Revolutionize PeopleSoft Reporting with Fluid
Table of Contents
Revolutionize
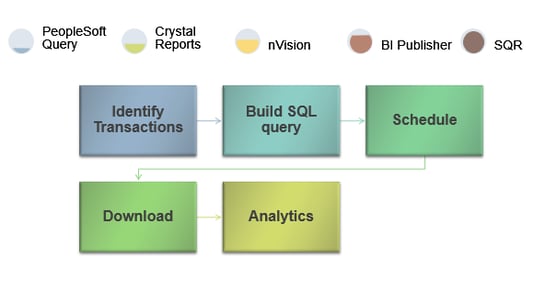
For years now the de-facto standard has been PS Query and batch programs like AE and SQR, outputs of which are downloaded and “massaged” in Excel to get the data to the end state desired. While there may be a method to this madness, the reality is that Customers have sadly accepted a very low standard of technology and capability when it comes to PeopleSoft Reporting. From the look and feel to the interactiveness of reports, PeopleSoft and the reporting capabilities provided by PeopleTools has been boring at best.
This is a snapshot of our reporting world today:-
What Customers really want is a dynamic, proactive, role-based, contextual and easy to use Reporting Solution or Platform that does not depend on a batch, that is accessible through multiple devices (think mobile first) and is rich in its presentation when it needs to be and tactical and detailed otherwise.
Enter PeopleTools 8.55. With new features like Pivot Grids, Fluid Tiles, Simplified Analytics available from PeopleTools 8.54 onwards, there are options to simplify reporting to a great extent, on both classic and the fluid platform:
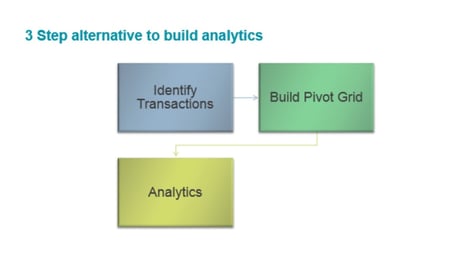
What Options are Available Today?
If you are still on the classic platform or you are apprehensive about adopting fluid so early on, you still have several options to revamp your reporting and rise several feet above SQL queries.
PeopleSoft Workcenters and Dashboards give users the ability to build a centralized platform for transactions and reporting.
WorkCenters: WorkCenters are a one-stop-shop for key roles within a business process to conduct transactions, take action on alerts, and view reports and analytics.
Dashboards: The dashboard will provide access to key information and real-time analytics allowing users to drill into each of these analytics and view the detailed transactions.
Interested in PeopleSoft Fluid?
Here is a resource that tells you about it.
Fluid User Interface
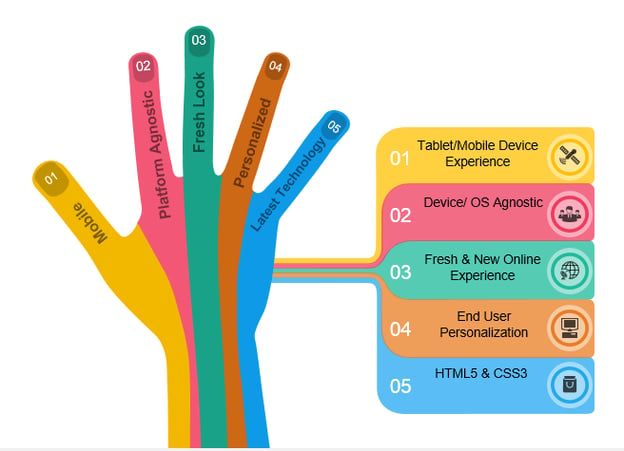
However, if you have decided to take the plunge and are ready to take advantage of the more dynamic, more modern and intuitive user interface offered by PeopleSoft, then these are the benefits that you will be signing up for:
Taking Advantage of the Latest PeopleTools Technology for Reporting
The question now is how does the user transition from archaic SQL queries to a more dynamic, proactive, role-based, contextual, and easy to use Reporting Solution.
This transition can be summarized in a few high-level steps that will convert your reporting queries into pivot grids and charts, a more flexible view of data allowing easy slicing and dicing, which can then be incorporated into Dashboards (classic platform) or on Fluid homepages as fluid tiles, PeopleTools 8.54 or higher.
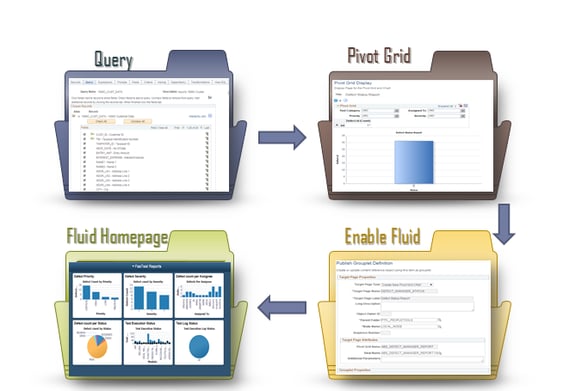
Step 1: Pick the PS_Query you wish to project as a report.
Navigation: Reporting Tools - Query Manager
Step 2: Using the existing Pivot grid technology, construct a pivot grid built on the PS_Query by wisely choosing the data to be reported on the chart axis, the filters, and the prompt values.
Navigation: Reporting Tools - Pivot Grid- Pivot Grid Wizard
Step 3: Publish the pivot grid as a pagelet.
Navigation: Reporting Tools - Pivot Grid- Pivot Grid Wizard. Publish as a pagelet
Step 4: Choose an existing dashboard or create a new one. Incorporate the pivot grid on the dashboard to view live metrics of the underlying data.
Navigation: PeopleTools - Portal - WorkCenter - Manage WorkCenter Dashboards
If you have fluid enabled:-
Step 5: Use the Tile wizard to convert an existing pivot grid into a tile.
Navigation: PeopleTools - Portal - Tile Wizard (8.55)
Step 6: Publish it as a public/private Tile.
Navigation: PeopleTools - Portal - Tile Wizard (8.55). Publish as a public tile
Step 7: Use an existing Homepage or create a new one and add this tile to be displayed on the homepage.
Navigation :- Fluid Homepage - Personalize. Add new tile
Step 8: Create contextual reports by using Simplified analytics.
his overview was to present the powerful options that are available in PeopleSoft for users to evolve from SQL based reporting to something more flexible and more intuitive was an eye-opener to the possibilities.
Ready to get started with Fluid?
Schedule a meeting with an Astute team member

Supriya is Team Leader at Astute for Chatbots and Integration with 13+ years of experience working with clients around the globe.
Search
Related Posts
Subscribe Our Newsletter
Gain access to exclusive insights, technical know-how and crucial knowledge from Astute experts.
Share Article
See The Team In Action
Upcoming Events
-1.png)
Reach Out
Ready to Connect?
Please fill the following form, we will get back to you within a business day.
Contact Form
Contact Us
